




By Application
By CPU
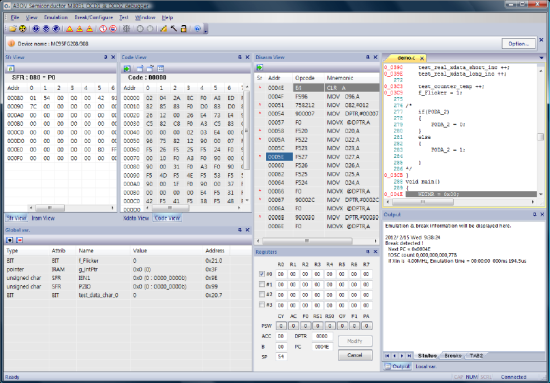
OCD Debugger is a source level 8-bit debugger program for Windows PC.
The OCD Debugger has many features listed below to debug the target microcontroller that is connected to the on-chip debugger interface, such as the E-OCD II.
▶ Detects the target device automatically.
▶ Uses symbolic debugging.
▶ Source file view
▶ Global/Local variables view
▶ Special function register (SFR) view for each device
▶ Display of various target memories: CODE, XDATA, IDATA, and SFR
▶ Users can edit these data sets directly in the debugger.
▶ Display of code data in a disassembled format
▶ Supports line assembly.
▶ Supports break toggling.
▶ Code Checksum calculation
▶ Supports the following emulation methods:
- Real-time emulation
- Step emulation (source line level or code level)
- Emulation abortion
▶ Automatically saves and loads the most recent debugging environment.
| Title | Type | Language | Version | Download |
|---|---|---|---|---|
| OCD Debugger 64-bit |

|
Eng | 2.050.10 |

|
| OCD Debugger 32-bit |
|
Eng | 2.047.00 |
|
| Title | Type | Language | Version | Download |
|---|---|---|---|---|
| E-OCD II Debugger Manual |

|
Eng | 1.0.2 |
|
| Starter Kit E-OCD Hardware Manual |
|
Eng | 1.0.0 |
|
| Title | Type | Language | Version | Download |
|---|---|---|---|---|
| OCD Debugger History |
|
Eng | 2.047.00 |
|
| Title | Type | Language | Version | Download |
|---|---|---|---|---|
| DLL file for IAR EW8051 V10.3x/V10.4x |
|
Eng | 2.047.00 |
|
| DLL file for IAR EW8051 V10.1x/V10.2x |
|
Eng | 2.047.00 |
|
| DLL file for KEIL 8051 Debugger |

|
Eng | 2.047.00 |
|
* For further information on the products, please contact: sales_gl@abov.co.kr


ABOV Semiconductor Co. Ltd. COPYRIGHT 2026 ABOV Semiconductor Co., Ltd. ALL RIGHTS RESERVED.